
Dashboard & Analytics
See what's playing, who's watching, and how your library performs
The Dashboard is the first thing you see after logging in: a live view of your library's activity.
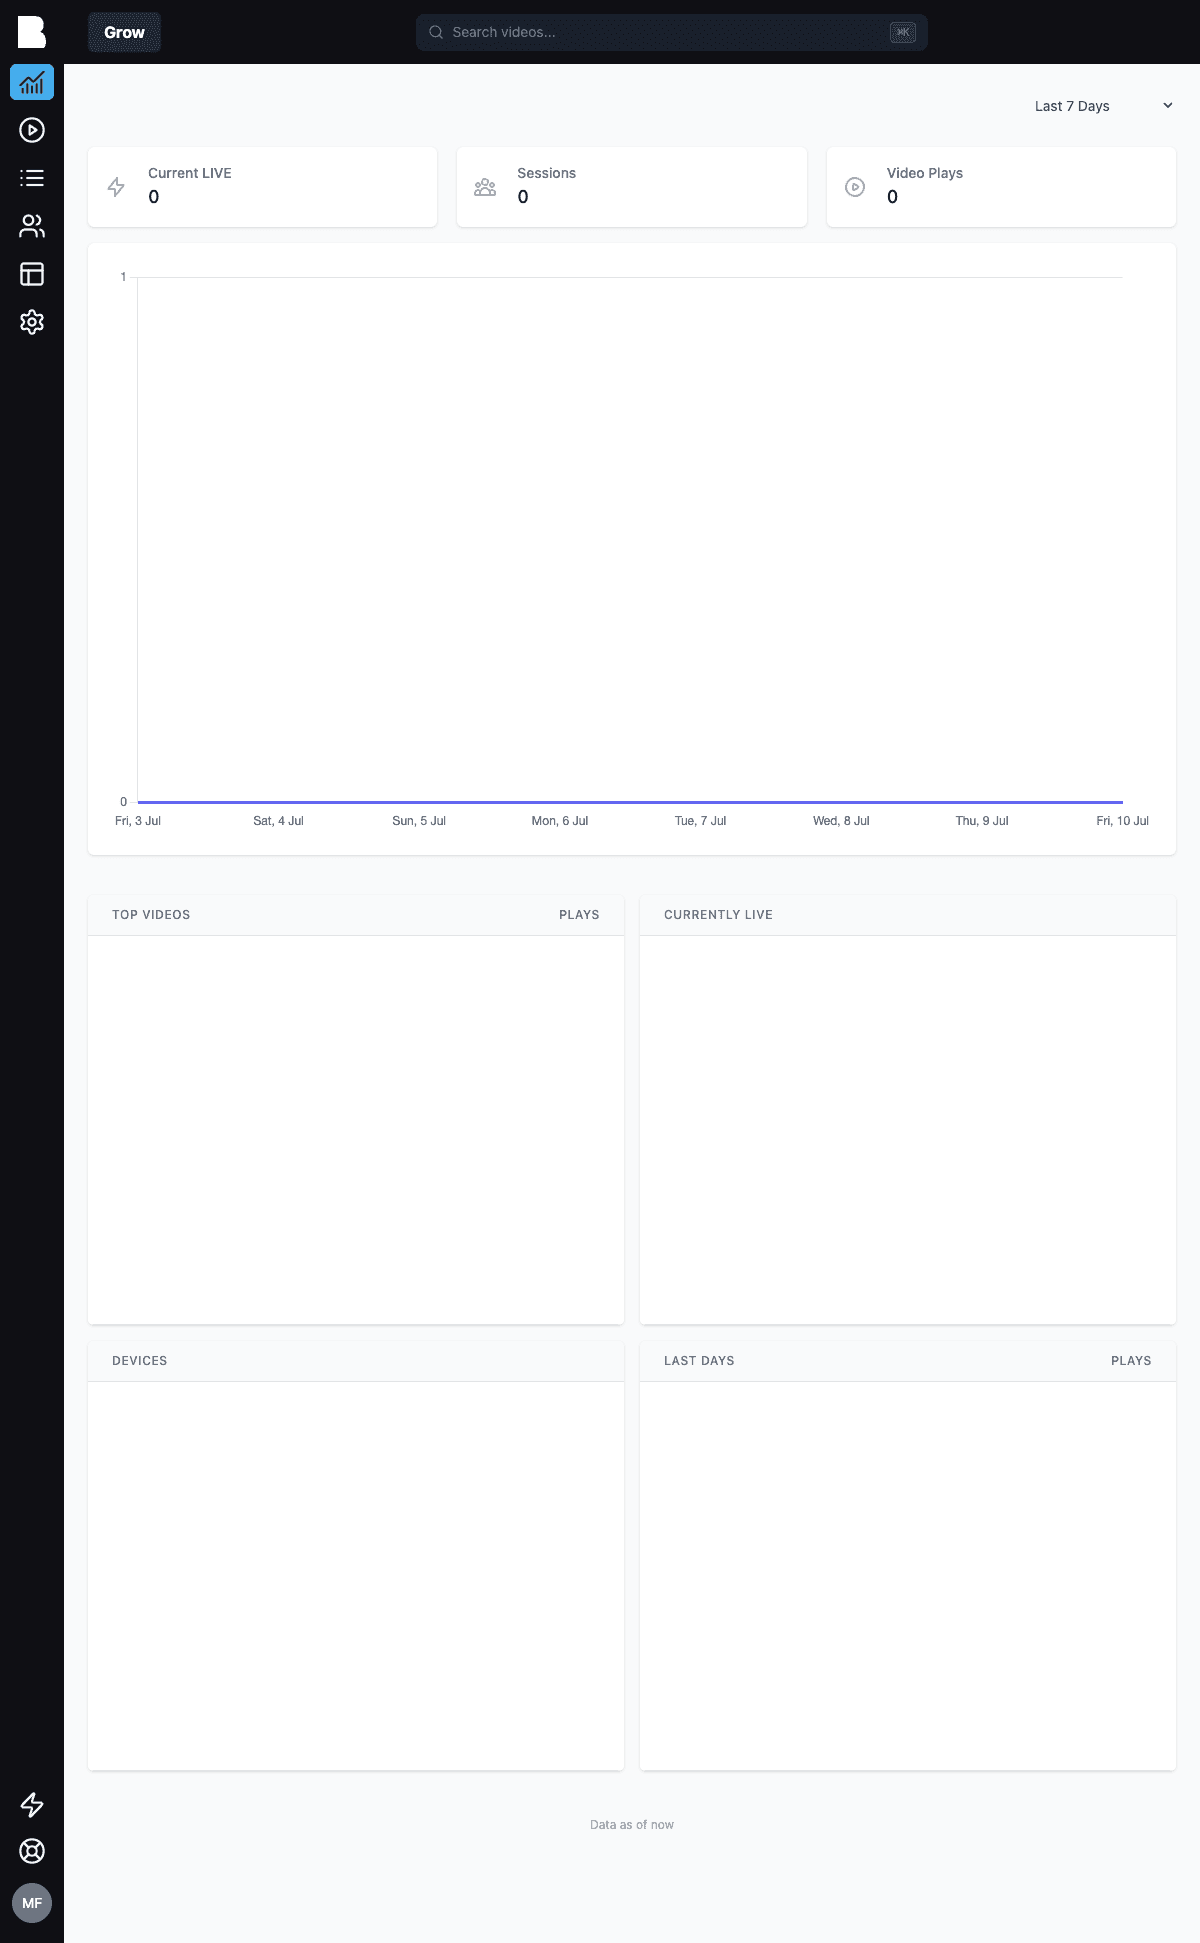
What you'll find
- Current LIVE: how many viewers are watching right now
- Sessions and Video Plays: for the selected time range
- Top Videos: your most-played content
- Currently live: which videos are being watched at this moment
- Devices: what your audience watches on
- Last Days: plays over time
Use the range selector (Today, Yesterday, Last 7 / 30 / 90 Days, All Time) to zoom in or out.
Portal analytics
Dashboard metrics cover playback across portal, embeds, and API-driven players. If you also want page-level web analytics for your portal (referrers, page views), connect Plausible, GA4, or Fathom under Portal → Analytics.
Plan availability
Engagement analytics (member-level viewing insight) is available on Growth and Enterprise plans.
Tracking from custom frontends
Building headless? Report playback events from your own player with the SDK's analytics methods so your dashboard stays accurate.